Exercise 1
Goal
The goal with this exercise is to record the values that the light sensor module outputs when used on different colors. Also we will observe what values are displayed when the sensor is used on black and white and discuss why these values can be used as the threshold values.
Plan
The plan for this exercise is simple: We will place the light sensor above different colors while keeping the distance constant so this does not interfere with the recorded values.
Results
Following the approach described above we got the results listed in the table below:
| Color | Displayed percentage |
| Green | 39 |
| Yellow | 49 |
| Red | 47 |
| Blue | 43 |
| Black | 35 |
| White | 49 |
As can be seen in the table the black and white serve as threshold values and this can be attributed to the light sensor that only measures in black and white. This means that the colors are only seen in grayscale and therefore they will be somewhere inbetween the black and white nuances.
Exercise 2
Goal
The goal for this exercise is the same as exercise 1 with one change: The floodlight on the light sensor is turned off.
Plan
We will use the same procedure as in exercise 1.
Results
The results following the plan are listed in the table below:
| Color | Displayed percentage |
| Green | 39 |
| Yellow | 47 |
| Red | 48 |
| Blue | 44 |
| Black | 35 |
| White | 50 |
As can be seen from the values in the table, the black and white measurements serve as the threshold values again. The values are almost the same as with the floodlight turned on, but this is most likely because we placed the light sensor too far away, about 3-5 cms.
Exercise 3
Goal
To see what happens when the sample interval between readings with the light sensor is increased.
Plan
Try running the program with four different sample intervals: 10 ms, 100 ms, 500 ms and 1000 ms.
Results
Increasing the interval between readings decreases the reliability of the robot. Since the robot keeps moving according to the last reading, a longer interval can cause it to easily veer off course.
Exercise 4
Goal
To observe, from gathered data, what influence a change in the sample interval has on the oscillations of the robot.
Plan
Using the DataLogger class we will record the values measured by the light sensor and plot them in a graph to see the oscillations and compare them.
Results
The oscillations have recorded and plotted in the following graphs, the interval used is given in the legend:
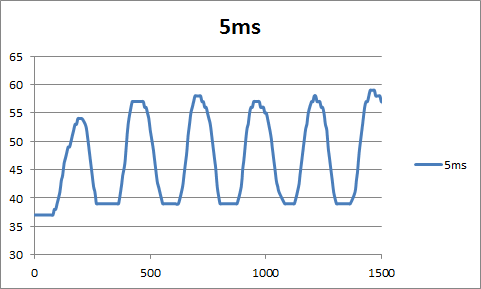
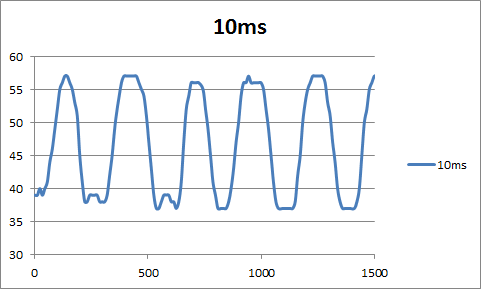
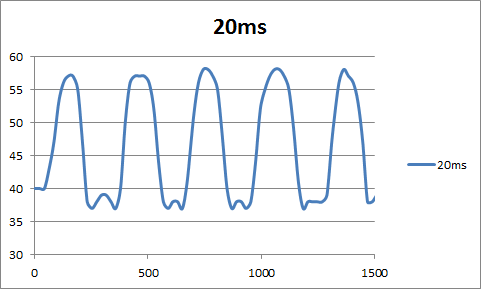
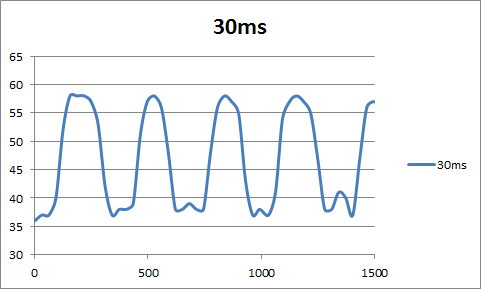
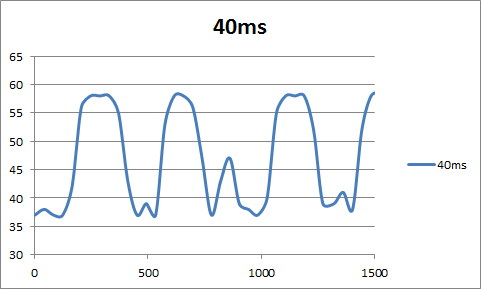

As can be seen from the graphs, the longer the interval, the longer the oscillation.
Exercise 5
Goal
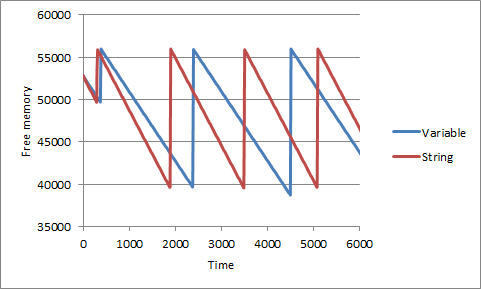
To observe what influence using strings directly in the calls to LCD.drawString() has on the free memory, during execution of the program, compared to using variables.
Plan
Run the program with strings directly and with variables. Use the DataLogger class to record the free memory and plot it in a graph to compare the two executions.
Results
The recorded free memory during the execution has been plotted in the graph below:
The results seem to show that allocation of space for the variable is slower than for the value, however we haven’t tried with the variable being a constant – update will be available soon.
Conclusion
The results given from the first two exercises are most likely not very accurate – the gathered data indicates that there’s not much difference between having the floodlight on or off. This is probably caused by the fact that we chose to place light sensor at a distance, about 3-5 centimeters, from the colored Lego plates. Therefore the ambient light has probably had a larger influence on the exercise with the floodlight than we thought it would, causing the observed values to be similar.
We discovered that using a high value for the interval caused our controlled artifact to not be able to follow a black line very reliably whilst using a low value gave the opposite result.
References
http://legolab.cs.au.dk/DigitalControl.dir/NXT/Lesson1.dir/Lesson.html
Martin, Fred G. Robotic Explorations – A Hands-On Introduction to Engineering
